Your blood test tells a story.

Vigil helps you understand it.

Your existing blood results, read marker by marker against longevity-optimal ranges and explained in plain English.

PDFs from Medichecks, or screenshots and photos from Thriva and other UK labs · 69 markers · UK & EU hosted

The product

See exactly how a marker reads.

Every result shows its value, where it sits relative to research-based optimal ranges, and a clear status. No health verdicts — a clean read, and a nudge toward the right conversation.

Interactive

Tap a marker.

Switch markers to watch the value, range and status update.

ApoB
Apolipoprotein B · Heart & circulation
1.12g/L
Optimal < 0.7 g/LStandard range < 1.3 g/LInside the standard range, above the optimal band.
Above optimal

About this marker: ApoB counts the cholesterol-carrying particles that can build up in artery walls over time — often a clearer long-term signal than LDL-C alone. Yours reads above the optimal range, so it’s a good one to raise with your GP.

Optimal ranges reflect associations reported in published research — not medical thresholds set by Vigil. Everything here is for education, not clinical decisions.

Reads the results you already have

MedichecksThrivaand most UK lab reports — PDF, screenshot or photo

69 markers across heart, blood sugar, liver & kidney, hormones and blood · See every marker →

Why Vigil

Typical isn't the same as optimal.

A standard lab range tells you whether a result is typical. Vigil also places it against a research-based optimal range, and explains what each marker measures.

  • Two ranges, side by side

    Your lab's range shows whether a result is typical. Vigil adds a second reference point — a research-based optimal range — for each marker.

  • An editorial read, marker by marker

    Plain-English context on what each marker is and what moves it — written as education, so your next GP conversation starts informed.

  • A reading, not a verdict

    Your current results, placed against research-based ranges. Health information to support better conversations with healthcare professionals.

How we read your results

Two ranges on every marker

Standard range — the lab's reference interval. It tells you whether a result is typical.

Optimal range — a narrower, research-based band Vigil uses for longevity. Because it's stricter, a result can sit inside the standard range and still outside optimal.

Each marker's own ranges, and why the optimal band sits where it does, are under About this marker.

How each marker is sorted

  • Within optimal — inside the optimal band.
  • To review — above or below the optimal band. Worth understanding, and perhaps discussing; not a diagnosis.
  • Not yet interpreted — a value we can't read as a single number (such as “<5”), or a marker without an optimal band. These are never counted as within optimal.

“Furthest from optimal”

Markers outside their band, ordered by how far each value sits past the nearest edge of that band, relative to the edge. It's an ordering of the numbers — not a clinical priority.

Where the numbers come from

Values are read from the PDF you uploaded, or the figures you entered. Personal details are removed before any AI processing.

Vigil provides health information and education, not medical advice or diagnosis. Optimal ranges differ from NHS clinical reference ranges — discuss any result with your GP before making changes.

ApoB
Above optimal
0.94g/L
Optimal < 0.7 g/LStandard range < 1.3 g/LInside the standard range, above the optimal band.
How it works

From results you already have to a read you can use. Three steps.

Step 01 · Upload

Bring your results.

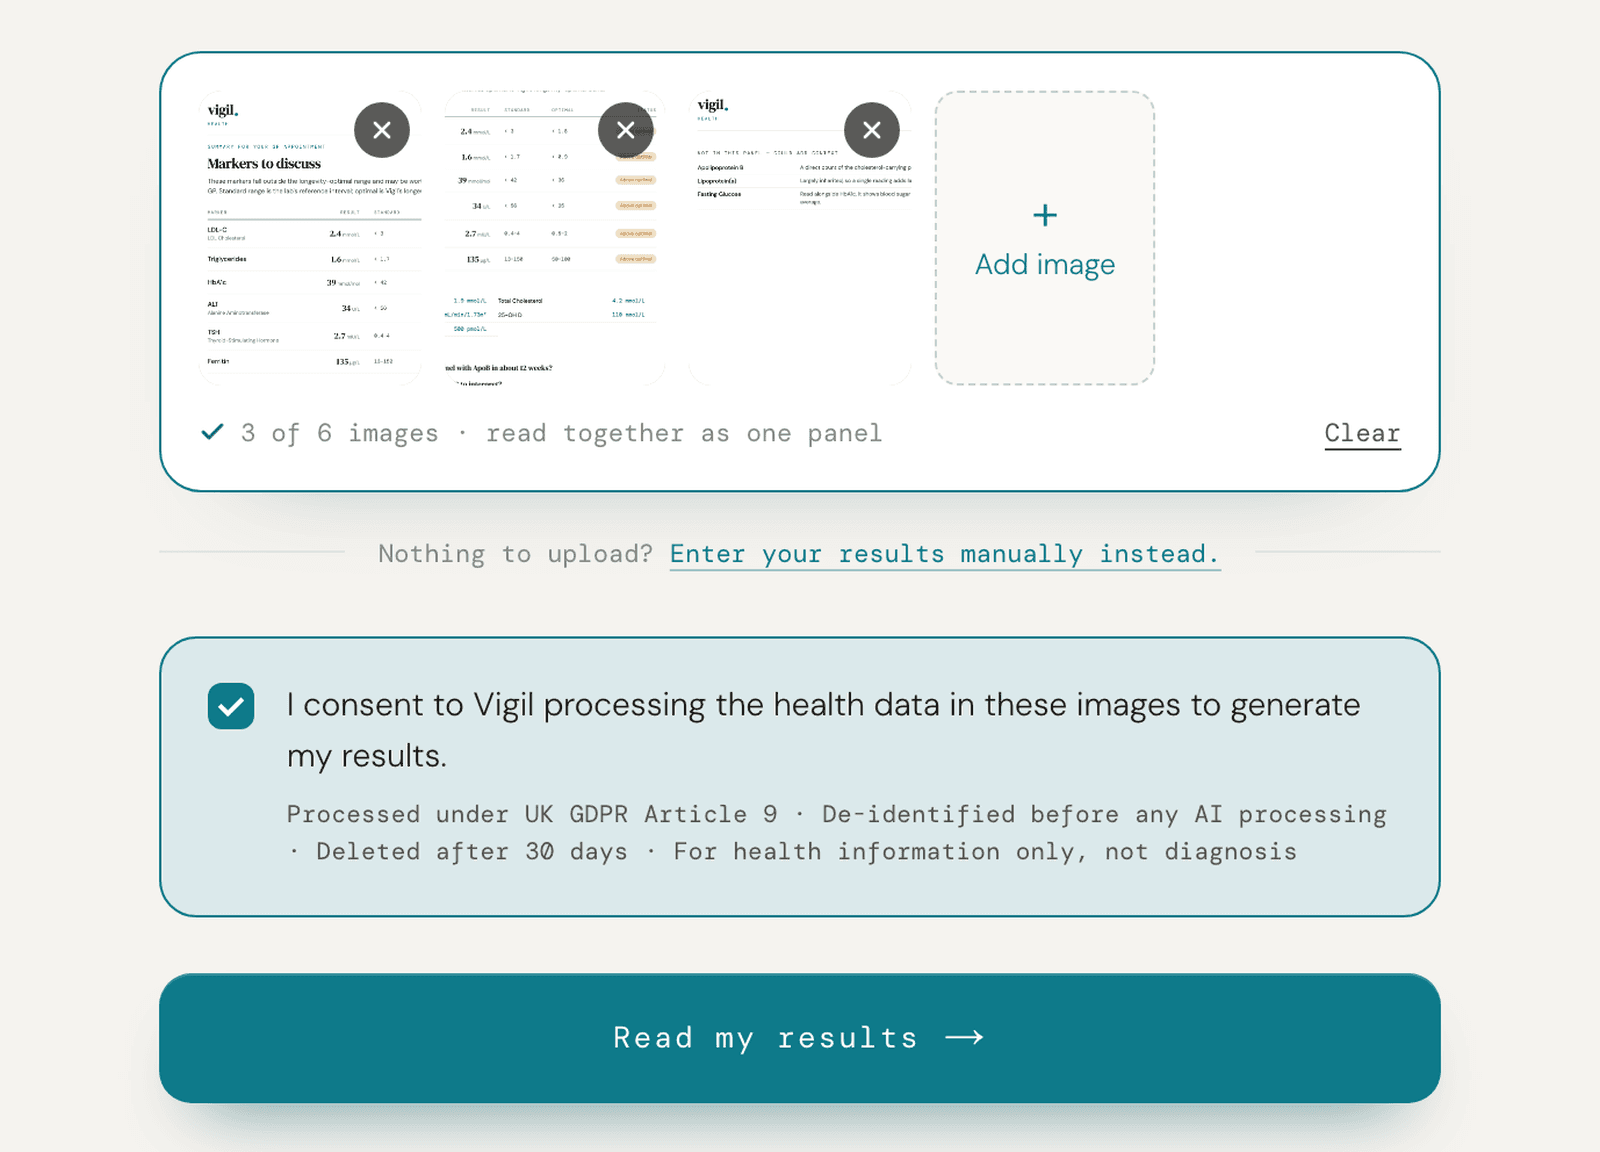
Drop in a Medichecks PDF, or screenshots or photos of your results from Thriva or another UK lab. Personal details are removed before your results are interpreted.

  • Reads 50+ marker names & aliases automatically
  • Your files stay hosted in the UK & EU
Three screenshots of blood test results selected for upload to Vigil
Step 02 · Map

Every marker against its optimal range.

See each result inside — or outside — the range tied to long-term health. A clear status chip, never a verdict on you.

  • In-optimal in teal, out-of-optimal in amber
  • Value, unit and range shown together, plainly
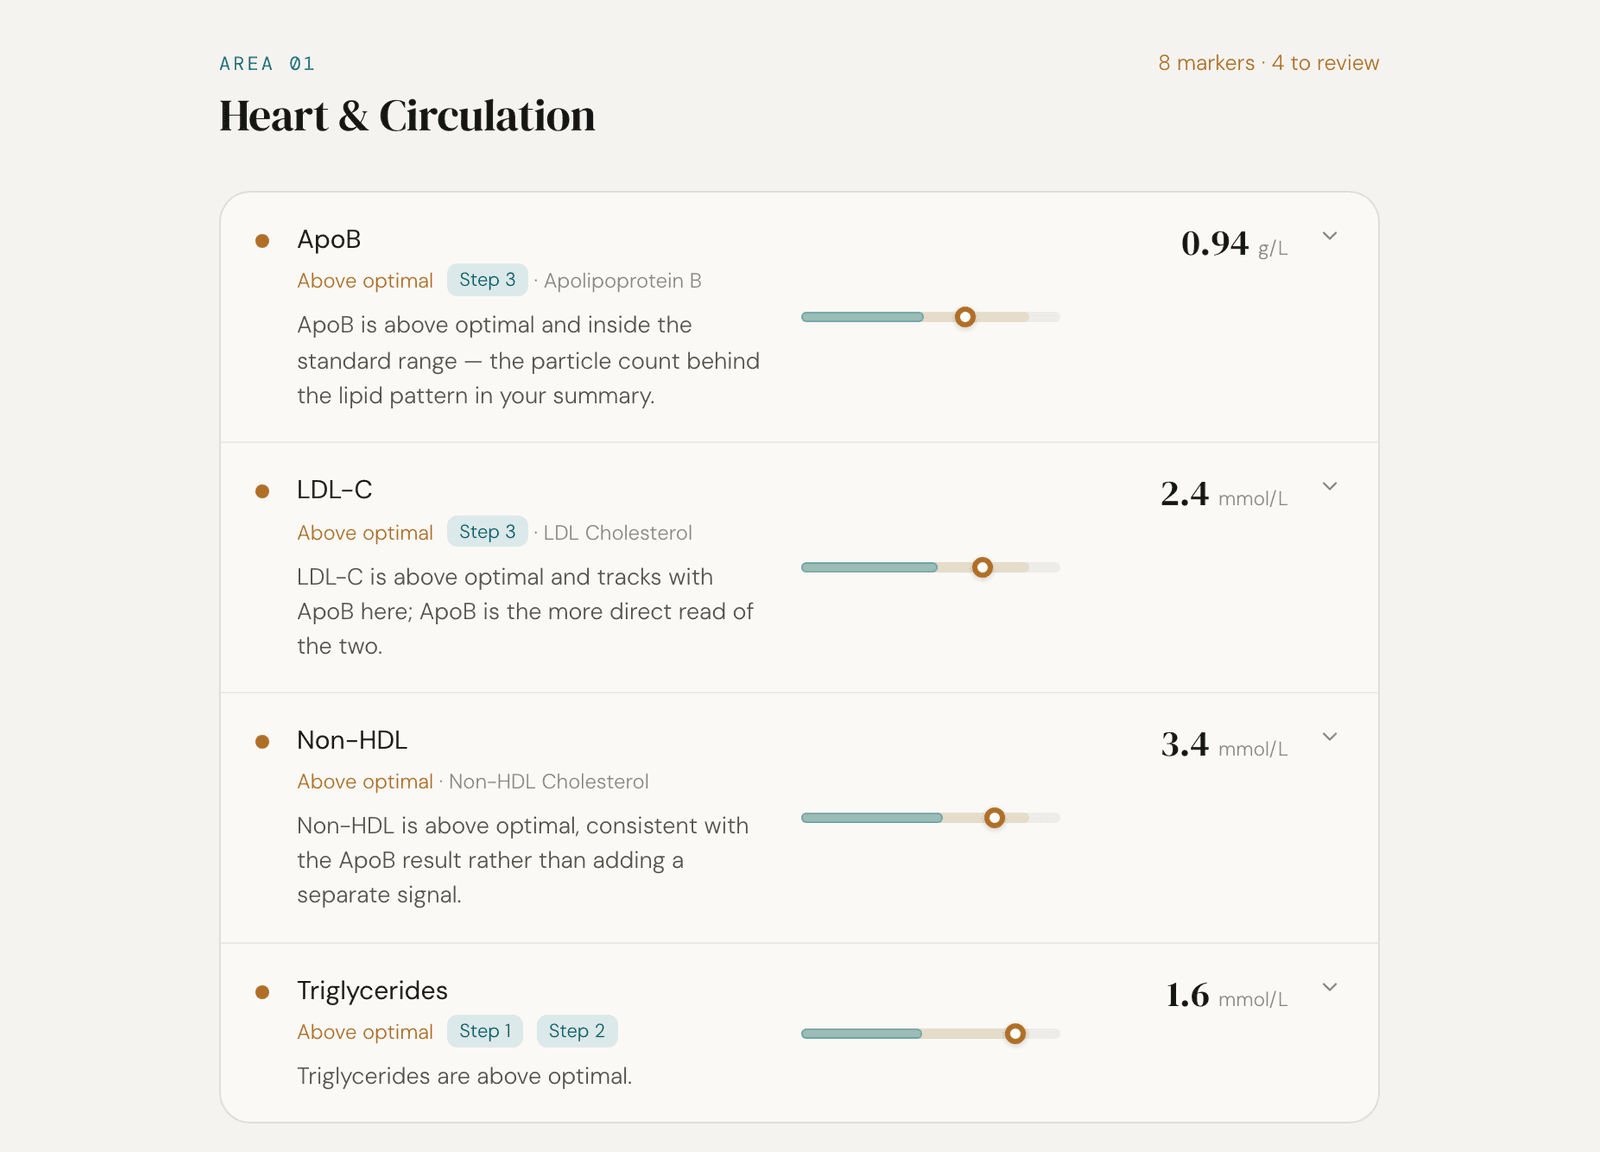
A Vigil report area: each marker as a row against its optimal range
Step 03 · Understand

Read it, marker by marker.

Plain-English context on each marker, framed as education — with specifics always routed back to your GP.

  • What the marker measures and what tends to move it
  • Health information only — never diagnosis or treatment
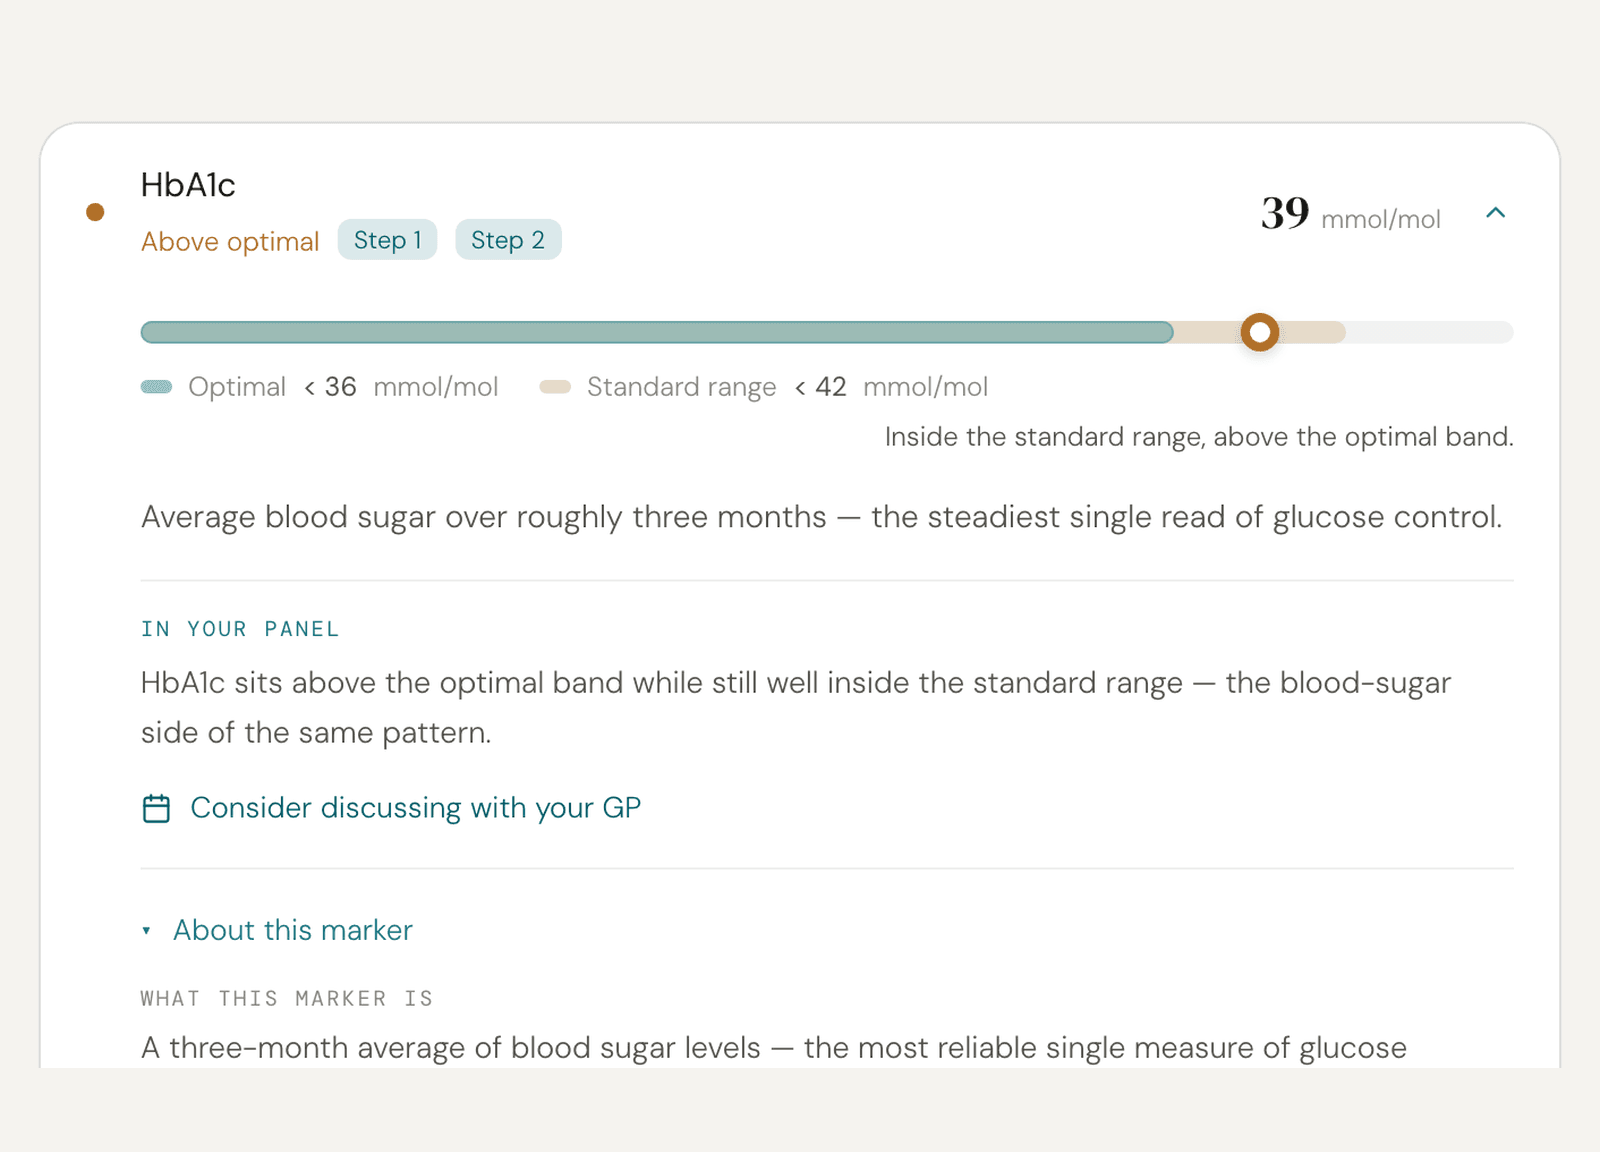
A single marker opened in Vigil, with plain-English context
The full report · £29

What the full report adds.

Your free read places every marker. The full report reads them together.

  1. The pattern across your markers

    Which results move together, and the shared driver behind them — or an honest note when there isn't one.

  2. A plan, ranked by leverage

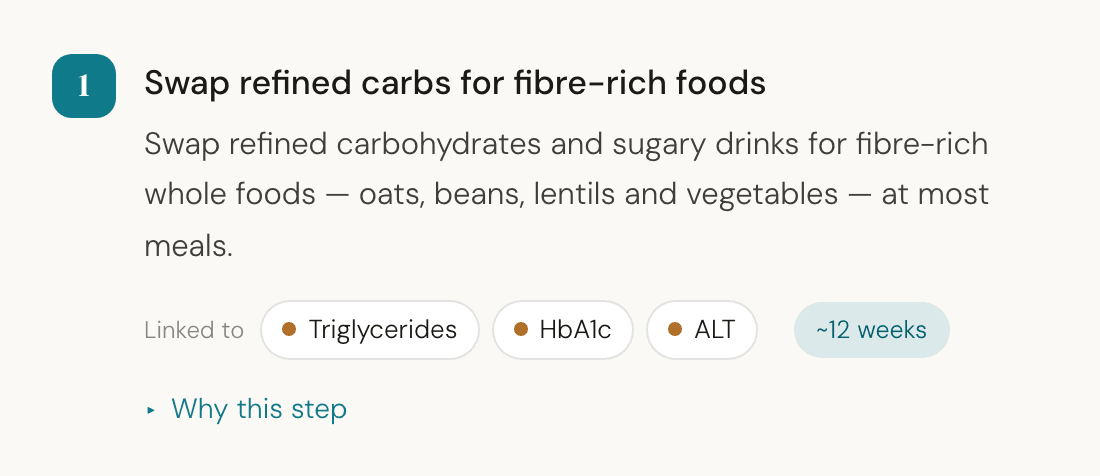
    Two to four specific steps, each showing the markers it's linked to and a timeframe.

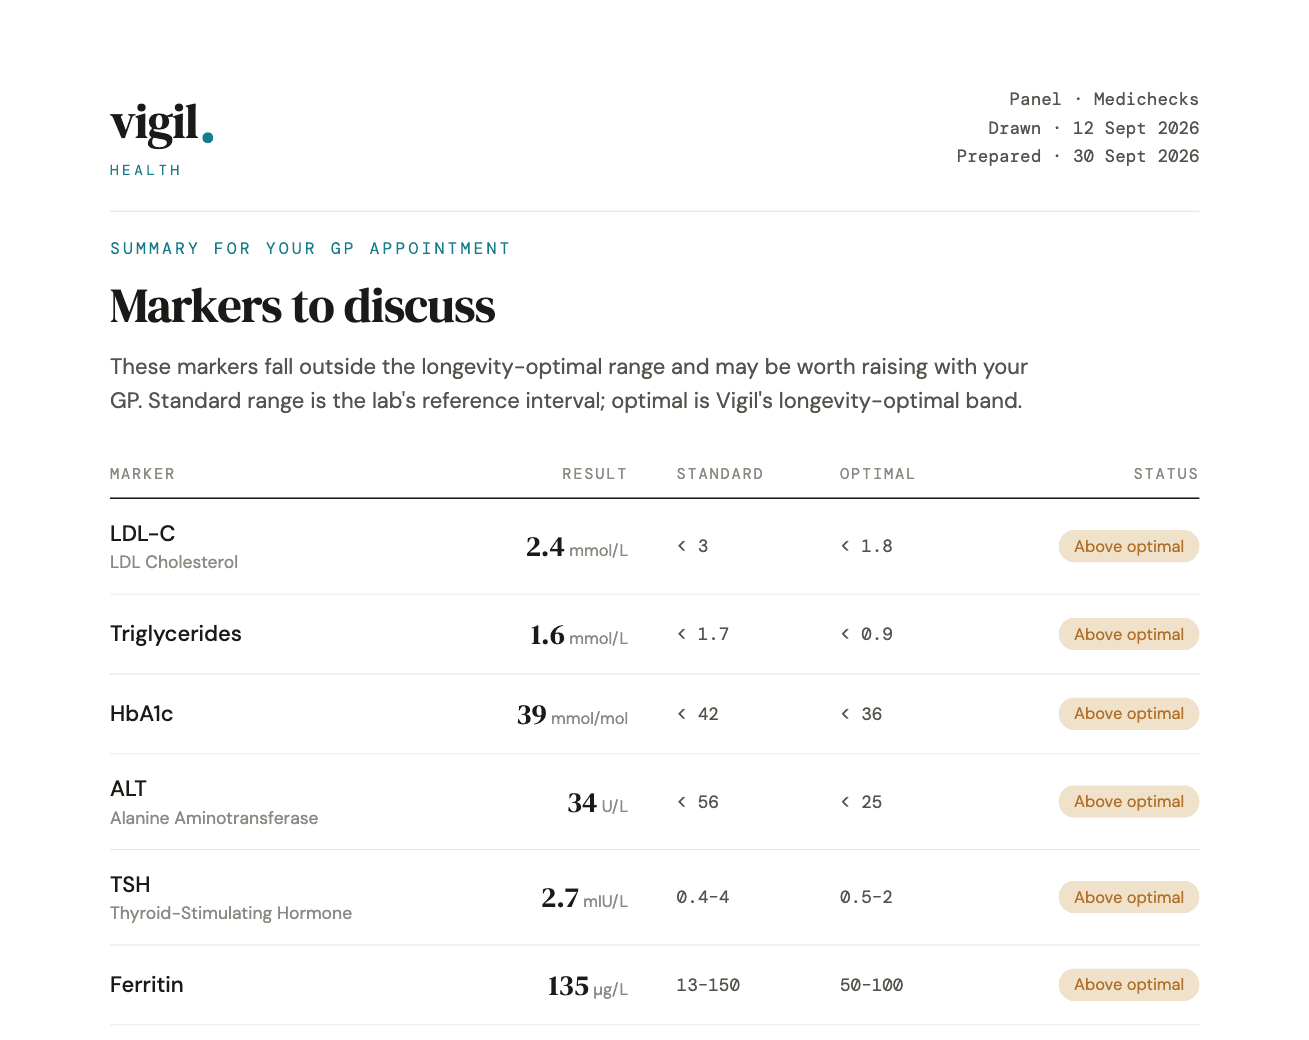
  3. A GP summary to take with you

    An A4 PDF of the markers to discuss, with both ranges and questions you could ask.

  4. Your next 12 weeks

    When to retest, and which markers could add context next time.

Start with a free read →Upgrade when you're ready.

The GP summary PDF: markers to discuss, with both rangesA plan step: its title, the markers it's linked to and a timeframe
Pricing at launch

Start free. Go deeper when it's worth it.

Free
Free
£0
One panel, read marker by marker.
  • 1 blood panel
  • Every marker placed against its optimal range
  • Plain-English explainer per marker
Get your free read
One-off
Report
£29
A full editorial read of one panel.
  • The pattern across your markers
  • A ranked plan with timeframes
  • GP summary PDF and questions
  • Kept for 12 months
Start with a free read
Coming soonPro · £99/yrTrack panels over time — unlimited panels and trends across draws.
Join the list →

Pricing shown for launch · every plan starts with a free read

Questions, answered

The things people ask first.

No. Vigil provides health information and education only. It doesn't diagnose, treat or offer a clinical opinion, and it isn't a substitute for professional care. Anything specific to your health belongs in a conversation with your GP.

A standard lab reference range describes where most people's results fall, and it's used to flag results that need clinical attention. Optimal ranges are narrower bands that published research has associated with long-term health. Vigil shows both, side by side. It doesn't invent these thresholds or make a clinical judgement about your result — the ranges reflect research associations, and everything is shown for education to support a conversation with your GP, not to replace one.

Upload a PDF from a UK lab, or screenshots or photos of your results — up to 6 images, read together as one panel. Medichecks PDFs, and screenshots or photos from Thriva and most other UK labs, are read automatically, including their different names for the same marker. If something can't be read, you can enter your values by hand. You bring results you already have; there's no new blood draw.

Your results are special-category health data under UK GDPR. They're stored and processed only in the UK and EU, and read only with your explicit consent. Personal details such as your name and date of birth are removed before your results are interpreted. Without an account, a free read is deleted 30 days after upload and a full report 12 months after purchase. With an account, you can export or delete everything at any time.

The free read places every marker against its optimal range and explains what it measures. The full report reads your markers together: the pattern across them, a ranked plan with timeframes, a GP summary PDF with questions you could ask, and when to retest. It's kept for 12 months.

Some PDFs are scanned images rather than text — upload a screenshot or photo of the page instead. If an image is blurry or cropped, try a sharper screenshot. Or enter your values by hand: it takes a few minutes and gives the same read.

Yes. The full report includes a GP summary: an A4 PDF listing the markers to discuss, with both ranges and questions you could ask.

Open beta

See where you stand.

Upload the results you already have and get a free read of every marker in minutes.

Analyse your bloodwork — free →
Not ready to upload? Leave your email instead
Free · no card needed · UK & EU hosted